From one-off data collection, to continual updates. From constant city boundaries, to sector-specific functional clusters. From thousands of data points, to millions and growing. The UK Tech Innovation Index 2.0 is ready to scale, powered by The Data City.
Select a cluster category to begin:
Click a city to explore:
Overall score:
Overall rank:
- Businesses
- Events and meetups
- Scientific Publications
How we define clusters.
UK Tech Innovation 2 is unconstrained by standardised geographies. In deciding where clusters are we consider only the geography and links between businesses, universities, institutions, event venues, and people.
Clusters are different sizes and shapes for different categories and they will change over time. Some will look very strange. We show the approximate geographical extent of the clusters on the map. We include names of cities within them so that they are recognisable.
How we chose categories.
We asked our users what they wanted, and picked five categories. They are the four contained in the UK Government's 2017 Industrial Strategy, plus advanced manufacturing.
With millions of rows of data, and thousands more rows every week we can't classify events by hand. Instead we use machine-learning.
Who are we and where's the data?
The new UK Tech Innovation Index is produced by The Data City with support from the Open Data Institute (ODI). The project is part of the ODI's innovation programme, a three-year, £6m programme to support and build upon the UK’s strengths in data and data analytics, funded by Innovate UK.
For more details on our methods and future plans, see our blog. For the open data that powers this tool, see our GitHub Repo. Last but not least, there's a report too.
FAQs
Why is London always top?
The results show the absolute size of the cluster. So bigger places score higher just because they're bigger. We have experimental scores divided by population, please get in touch if you'd like them.
Are Swansea and Cornwall really part of the same cluster?
Probably not. We think that our clustering algorithm gives good results about nine times out of ten. It struggles because one of the main factors it uses to assign points to clusters is physical proximity. It doesn't understand what water is for example. The reliance on physical proximity is reduced when we have data on links between businesses, events, and papers. Away from big cities that data is often poor. An improvement that we're working on is to consider travel time rather than physical proximity.
We've considered manually correcting clusterings that look wrong, and decided against it for three main reasons.
- Sometimes surprising clusterings are telling us something useful. Northern Ireland does have links with Scotland's highlands and islands, on clean energy for example.
- This would add even more of our biases to our tool. With an algorithm it is easier for us to see how it works, and fix assumptions that are wrong.
- it would be a lot of work and need repeating each time we add new data. Currently we're adding new data every week so this isn't a good investment of our time.
What do the scores mean?
The scores add to 100. They're the proportion of the UK's total ecosystem.
Why don't you have a score for each category for each cluster?
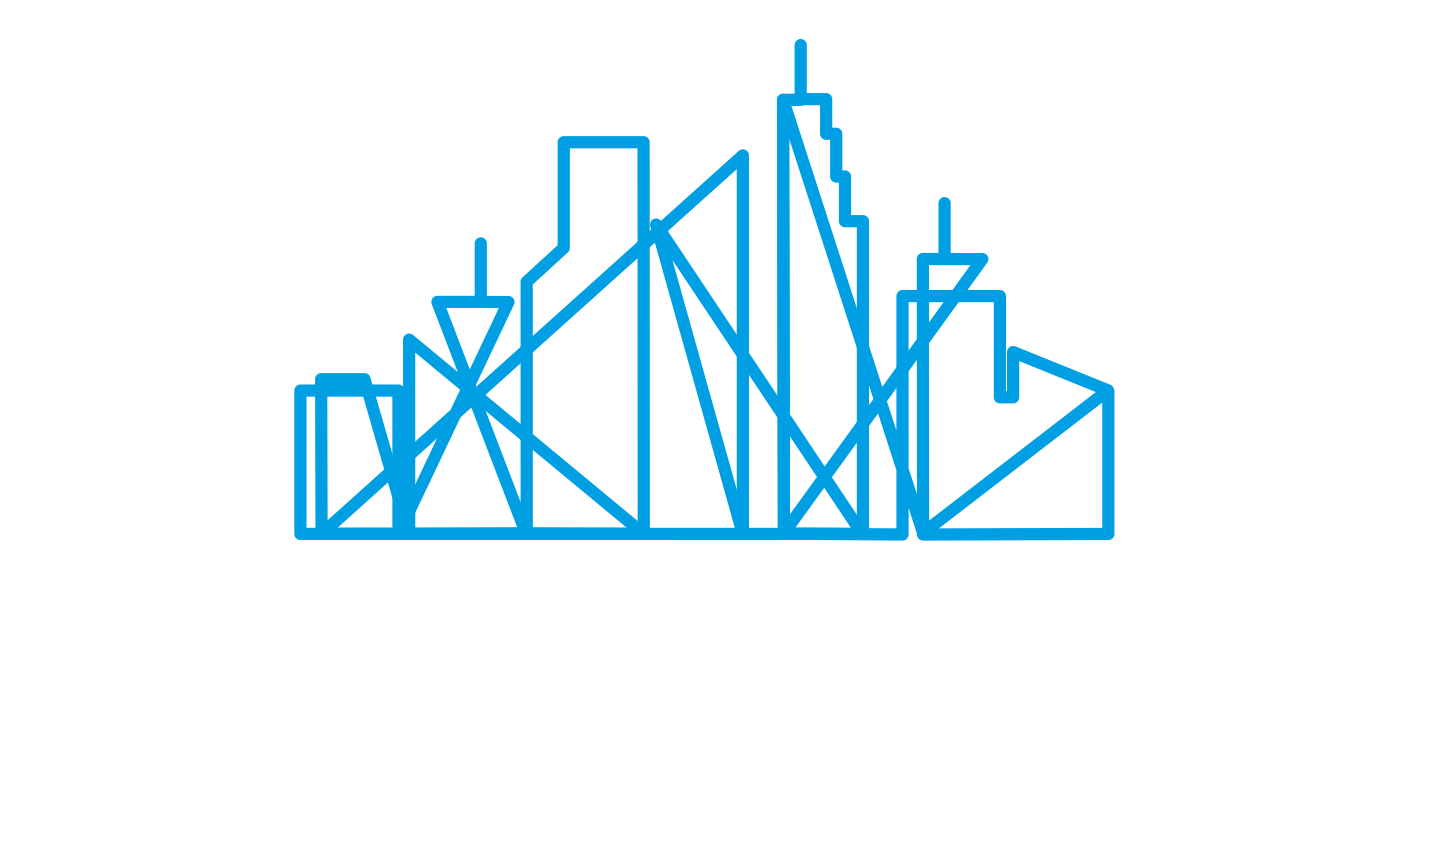
This comes back to how we define and name clusters. Below is an example from our map for the urban North-East of England in two categories, AI & Data and Clean Growth. In AI & Data our algorithm measures sufficient collaboration and proximity between Teesside, Wearside, and Tyneside to put them into a single cluster. We then name the cluster after the three largest places within it.
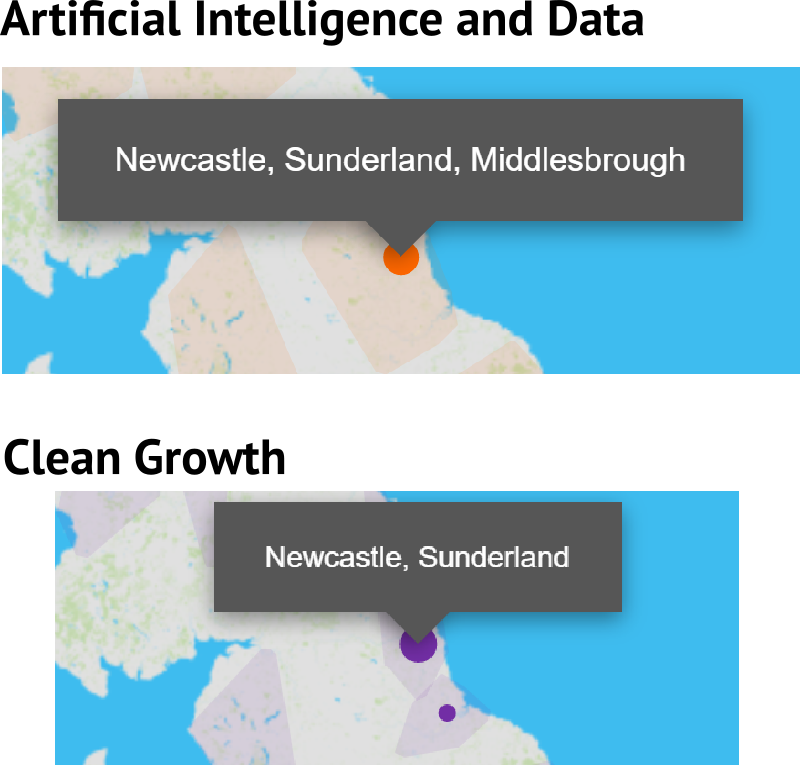
In Clean Growth the industry on Teesside is sufficiently strong and independent of Tyneside and Wearside that our algorithm places it in its own cluster.
Because of this, we don't have consistent geographies across industrial categories. We can't sensible give a score for each cateogy for each cluster.
What do you mean by "all events" and "total ecosystem".
We mean all the events, businesses and papers in The Data City. It's a tiny sample of the UK as a whole, but growing quickly.